Home screen
The home screen exists to answer, in three seconds, the question you ask every morning: is my aquarium all right?
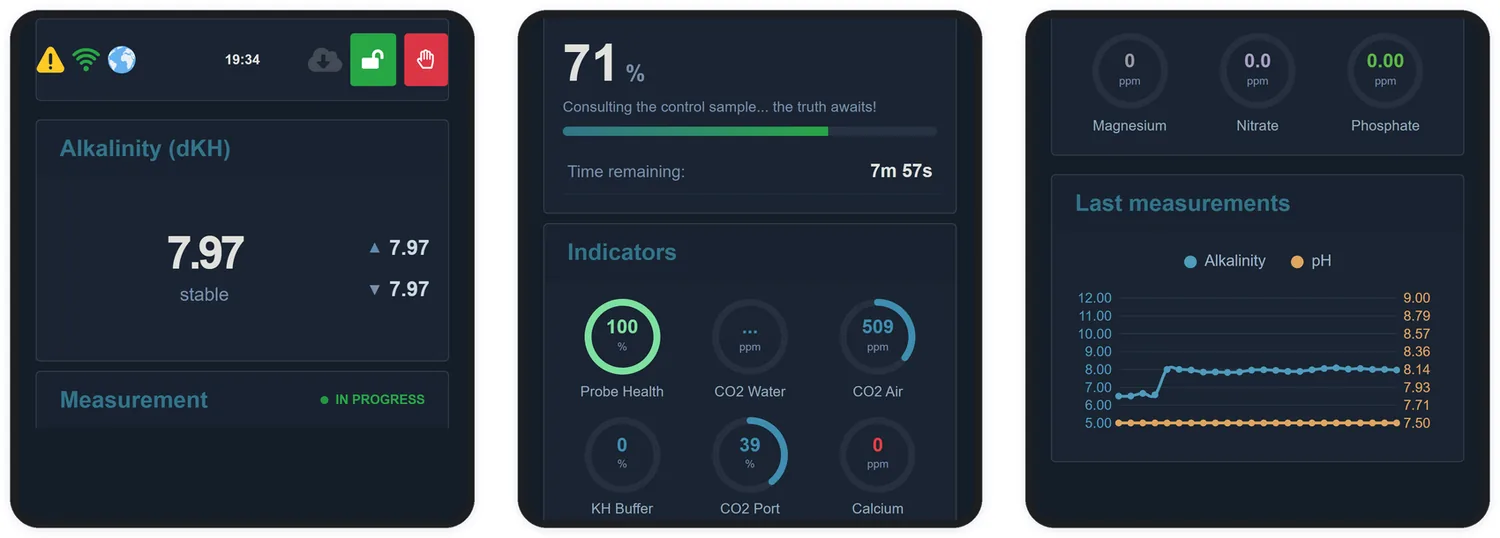
20.1 Status bar
Present on every screen, it shows four states of the equipment:
| Icon | Meaning |
|---|---|
| Alert | Lit when KH is outside the band set by target and margin |
| Wi-Fi | The equipment is connected to your network |
| Internet | The equipment has internet access and can reach the Aquarino cloud |
| Update | A new version is available to install |
On the right there are also the screen lock button, which prevents accidental taps, and the red stop button, which immediately interrupts whatever is running.
20.2 Alkalinity
The main block shows the current KH in large type, in the unit you chose, with a word underneath giving the trend — _stable_, for example.
Beside it are the highest and lowest values of the period, which show your aquarium's swing at a glance. Two close numbers mean a stable system; two distant ones, a system that oscillates.
20.3 Measurement
While a cycle is running, this block shows the percentage complete, the current stage and the time remaining. Outside a cycle it shows the date and time of the last and next measurement, and the suggested date for the next calibration.
20.4 Indicators
Nine dials show the state of the parameters the equipment tracks:
| Indicator | What it shows |
|---|---|
| Probe Health | Quality index of the pH probe, 0 to 100% (Chapter 12) |
| CO2 Air | Ambient CO2 concentration, in ppm. Between 400 and 600 ppm is usual indoors |
| CO2 Water | CO2 concentration in the aquarium water, in ppm |
| KH Buffer | How much is left in the doser reservoir, as a percentage. Turns red below the configured limit |
| Co2 Port | Percentage the port is driven for in the current hour (Chapter 17) |
| Calcium, Magnesium, Nitrate, Phosphate | Parameters you enter manually, from your own tests. The Aquarino KH does not measure these — it stores and displays them so you have the whole picture on one screen |
20.5 Last measurements
The line graph shows recent alkalinity and pH readings side by side. It is where the daily swing shows most clearly — and where you notice a trend before it becomes a problem.