PART IIIDay to day
CHAPTER 7
Reading the screen
The Display's screen was designed to be read at a glance: what matters is big, and everything else tells the story of the data — where it came from, when it arrived and whether it deserves your trust.
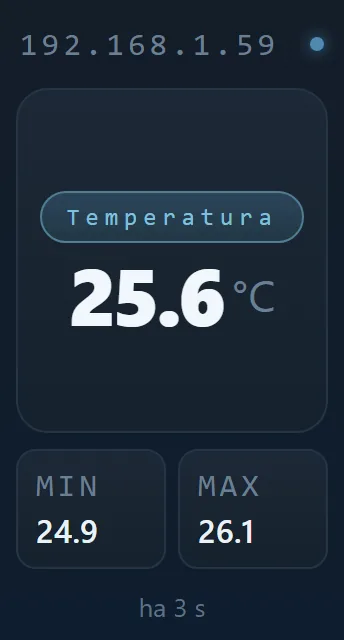
7.1 The top bar
| Element | What it shows |
|---|---|
| Identification | The name of the source device — on the 1.47" model, the Display's IP, to make reaching the portal easier |
| LAN / CLOUD pill | Which path the data is arriving through (Chapter 6) |
| Signal bars | The quality of the Display's Wi-Fi |
| Pulsing dot | The panel's heartbeat: pulsing means the Display is alive and reading |
| Clock | The current time |
| Gear | On the touch models, opens the settings right on the screen |
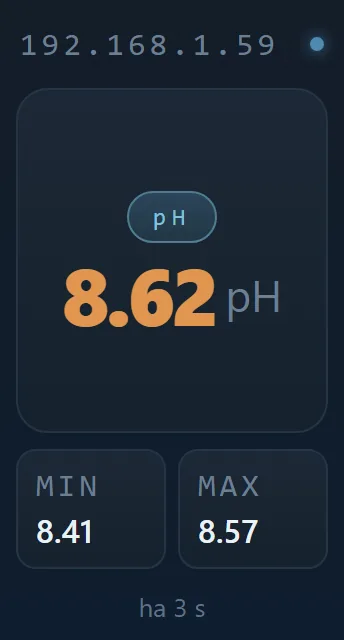
7.2 The featured sensor
- Name of the sensor, as it is on the source device;
- Current value, with its unit;
- MIN and MAX, the recorded extremes — sensors without a range (level, leak) show
--; - The value changes colour when the source device flags the condition: blue below the range, amber above.
7.3 The footer stamp
The footer answers a panel's most important question: when is this data from?
| Stamp | Meaning |
|---|---|
| UPDATED X MIN AGO | Fresh data, arriving at the expected pace |
| NO READING YET | The sensor exists but has not delivered its first value yet |
| LAST UPDATE ... | The data has gone stale — the value also fades, so it never passes for current |
| OFFLINE | The data source is not responding |